


Annual Disaster Statistical Review 2011: The Numbers and Trends (CRED - WHO)
In 2011, 332 natural disasters were registered, less than the average annual disaster frequency observed from 2001 to 2010 (384). However, the human and economic impacts of the disasters in 2011 were massive. Natural disasters killed a total of 30 773 people and caused 244.7 million victims worldwide (see Figure 1). Economic damages from natural disasters were the highest ever registered, with an estimated US$ 366.1 billion.
Over the last decade, China, the United States, the Philippines, India and Indonesia constitute together the top 5 countries that are most frequently hit by natural disasters. In 2011, the Philippines experienced the highest number of natural disasters ever registered in its history (33). The country was affected by 18 floods and landslides, 12 storms, 2 volcanic eruptions and one earthquake. Tropical cyclone 'Washi' (Sendong) struck the country in December and caused 1 439 deaths, making it the most lethal storm worldwide in 2011.
Amongst the top 10 countries in terms of disaster mortality in 2011, seven countries are classified as high-income or upper-middle income economies (see World Bank income classification). These countries accounted for 79.2% of global reported disaster mortality in 2011, mainly due to the Tōhoku earthquake and tsunami in Japan on March 11th. This mega-disaster caused nearly 19 850 deaths, representing 64.5% of worldwide disaster mortality in 2011.
The Tōhoku earthquake and tsunami in Japan was the most expensive natural disaster ever recorded, with estimated economic damages of US$ 210.0 billion. Floods in Thailand that occurred from August to December (US$ 40.0 billion), the February 22nd earthquake in New Zealand (US$ 15.0 billion), and storms in the United States in May (US$ 14.0 billion) and April (US$ 11.0 billion) also added significantly to the total disaster damages of 2011.
The disaster that made the most victims in 2011 was the flood that affected China in June, causing 67.9 million victims. Furthermore, China was affected by a drought from January to May (35.0 million victims), a storm in April (22.0 million victims) and another flood in September (20.0 million victims), further contributing to a total of 159.3 million victims in China in 2011, a figure representing 65.1% of global reported disaster victims. Droughts and consecutive famines made many victims in Ethiopia (4.8 million), Kenya (4.3 million) and Somalia (4.0 million). When considering the population size of the country, 42.9% of Somalia’s population was made victim of natural disasters in 2011, mostly due to drought.
Comparing 2011 with the previous decade shows that the number of victims increased compared to the annual average number of victims from 2001 to 2010 of 232.0 million. This increase is explained by the larger impact from hydrological disasters. Hydrological disasters caused 139.8 million victims in 2011 - or 57.1% of total disaster victims in 2011 - compared to an annual average of 106.7 million hydrological disaster victims from 2001 to 2010. In 2011, 66.8% of global hydrological disaster victims were from floods and wet mass movements in China.
Less people were killed by disasters in 2011 compared to 2010, when the Haiti earthquake alone caused the death of more than 222 500 people, and compared to the 2001-2010 annual average of 106 891 deaths. This is mainly explained by a lower number of deaths from geophysical disasters. However, geophysical disasters took the largest share of natural disaster fatalities in 2011, causing 20 949 deaths, and representing 68.1% of global disaster mortality in 2011. On average, geophysical disasters killed 69 098 people per year from 2001 to 2010.
The estimated economic losses from natural disasters in 2011 surpassed the last record year of 2005 (US$ 246.8 billion), and increased by 235% compared to the annual average damages from 2001 to 2010 (US$ 109.3 billion). Damages from geophysical disasters increased the most, from an annual average of US$ 24.1 billion during 2001-2010 to US$ 230.3 billion in 2011. Geophysical disasters represented a share of 62.9% of total damages caused by natural disasters in 2011.
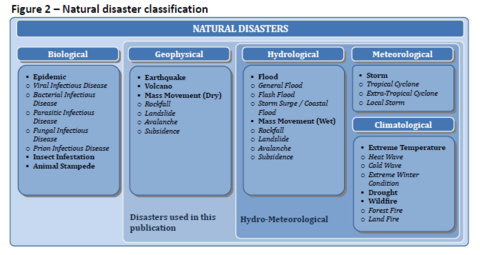
The lower number of reported natural disasters in 2011, when compared to the annual average occurrence from 2001 to 2010, was mostly due to a smaller number of hydrological and meteorological disasters. Hydrological disasters still took by far the largest share in natural disaster occurrence in 2011 (52.1%), followed by meteorological disasters (25.3%), climatological disasters (11.7%) and geophysical disasters (10.8%).
Looking at the geographical distribution of disasters, Asia was the continent most often hit by natural disasters in 2011 (44.0%), followed by the Americas (28.0%), Africa (19.3%), Europe (5.4%) and Oceania (3.3%). This regional distribution of disaster occurrence resembles the profile observed from 2001 to 2010. In 2011, Europe saw the largest decrease in disaster occurrence (68.7%), compared to the decade’s annual average, but also Asia and Oceania experienced less disasters. In particular, Europe was less frequently hit by climatological and hydrological disasters.
Asia accounted in 2011 for 86.3% of global disaster victims, followed by Africa (9.2%). The number of victims in 2011 increased especially in Africa and Asia, but also in the Americas and Oceania, whereas fewer victims were reported in Europe, compared to the 2001-2010 annual averages. On a more detailed note, hydrological disasters in Asia caused many more victims in 2011, but climatological disasters made fewer victims, compared to the decade’s annual averages. In Africa, it was climatological disasters, especially droughts in the Horn of Africa, which increased the number of victims.
In 2011, Asia also suffered the most damages (75.4% of global disaster damages), followed by the Americas (18.4%) and Oceania (5.6%). For both Europe and Africa, a share of 0.3% of global disaster damages was reported. This distribution of disaster damages between continents differs from the distribution seen over the last decade, when the Americas experienced the most damages, followed by Asia and Europe. Damages in Asia increased the most in 2011 compared to the 2001-2010 annual average, but damages in Oceania and the Americas were also higher. In contrast, damages in Europe decreased. More precisely, geophysical and hydrological disasters contributed most to the increased damages in Asia, mainly due to the Tōhoku earthquake and tsunami in Japan and the floods that affected Thailand from August to December.
EM-DAT’s global approach to the compilation of disaster data continuously provides us with valuable information and trends on the occurrence of natural disasters and their impacts on society. However, the development of guidelines and tools for the creation of national and sub-national disaster databases for the compilation of reliable, standardized, interoperable disaster occurrence and impact data should be prioritized for more effective disaster risk reduction.